China’s Contribution to Global Research

This figure is a line chart with the title "Institutional Ranking of Authors of Published Papers in Top 5 Percent of Journals" which shows how the geographic distribution of authors publishing in top academic journals has changed over time. The axis of yes is written "Literature review" and ranges from 0% to 60%. The X-axis shows the years from 1980 to about 2023. Five lines are shown: the United States in blue, the European Union in dark blue, China in dark red, high-income countries in medium blue, and middle- and low-income countries in light blue. The United States started at about 58% in 1980 and has slowly declined to 24% in the early 2020s. In the European Union it rose from around 23% in 1980, peaked at around 33% around 2000, and gradually fell to 25%. China's share was close to zero until the 1990s, started to rise around 2000, and increased significantly after 2010 to reach around 28% in the early 2020s, surpassing the US and the EU. High-income countries remained stable between 10% and 15% throughout the period. Middle- and low-income countries stayed below 7% for the entire period. The source code reads: "Statistics researchers use the Dimensions database."

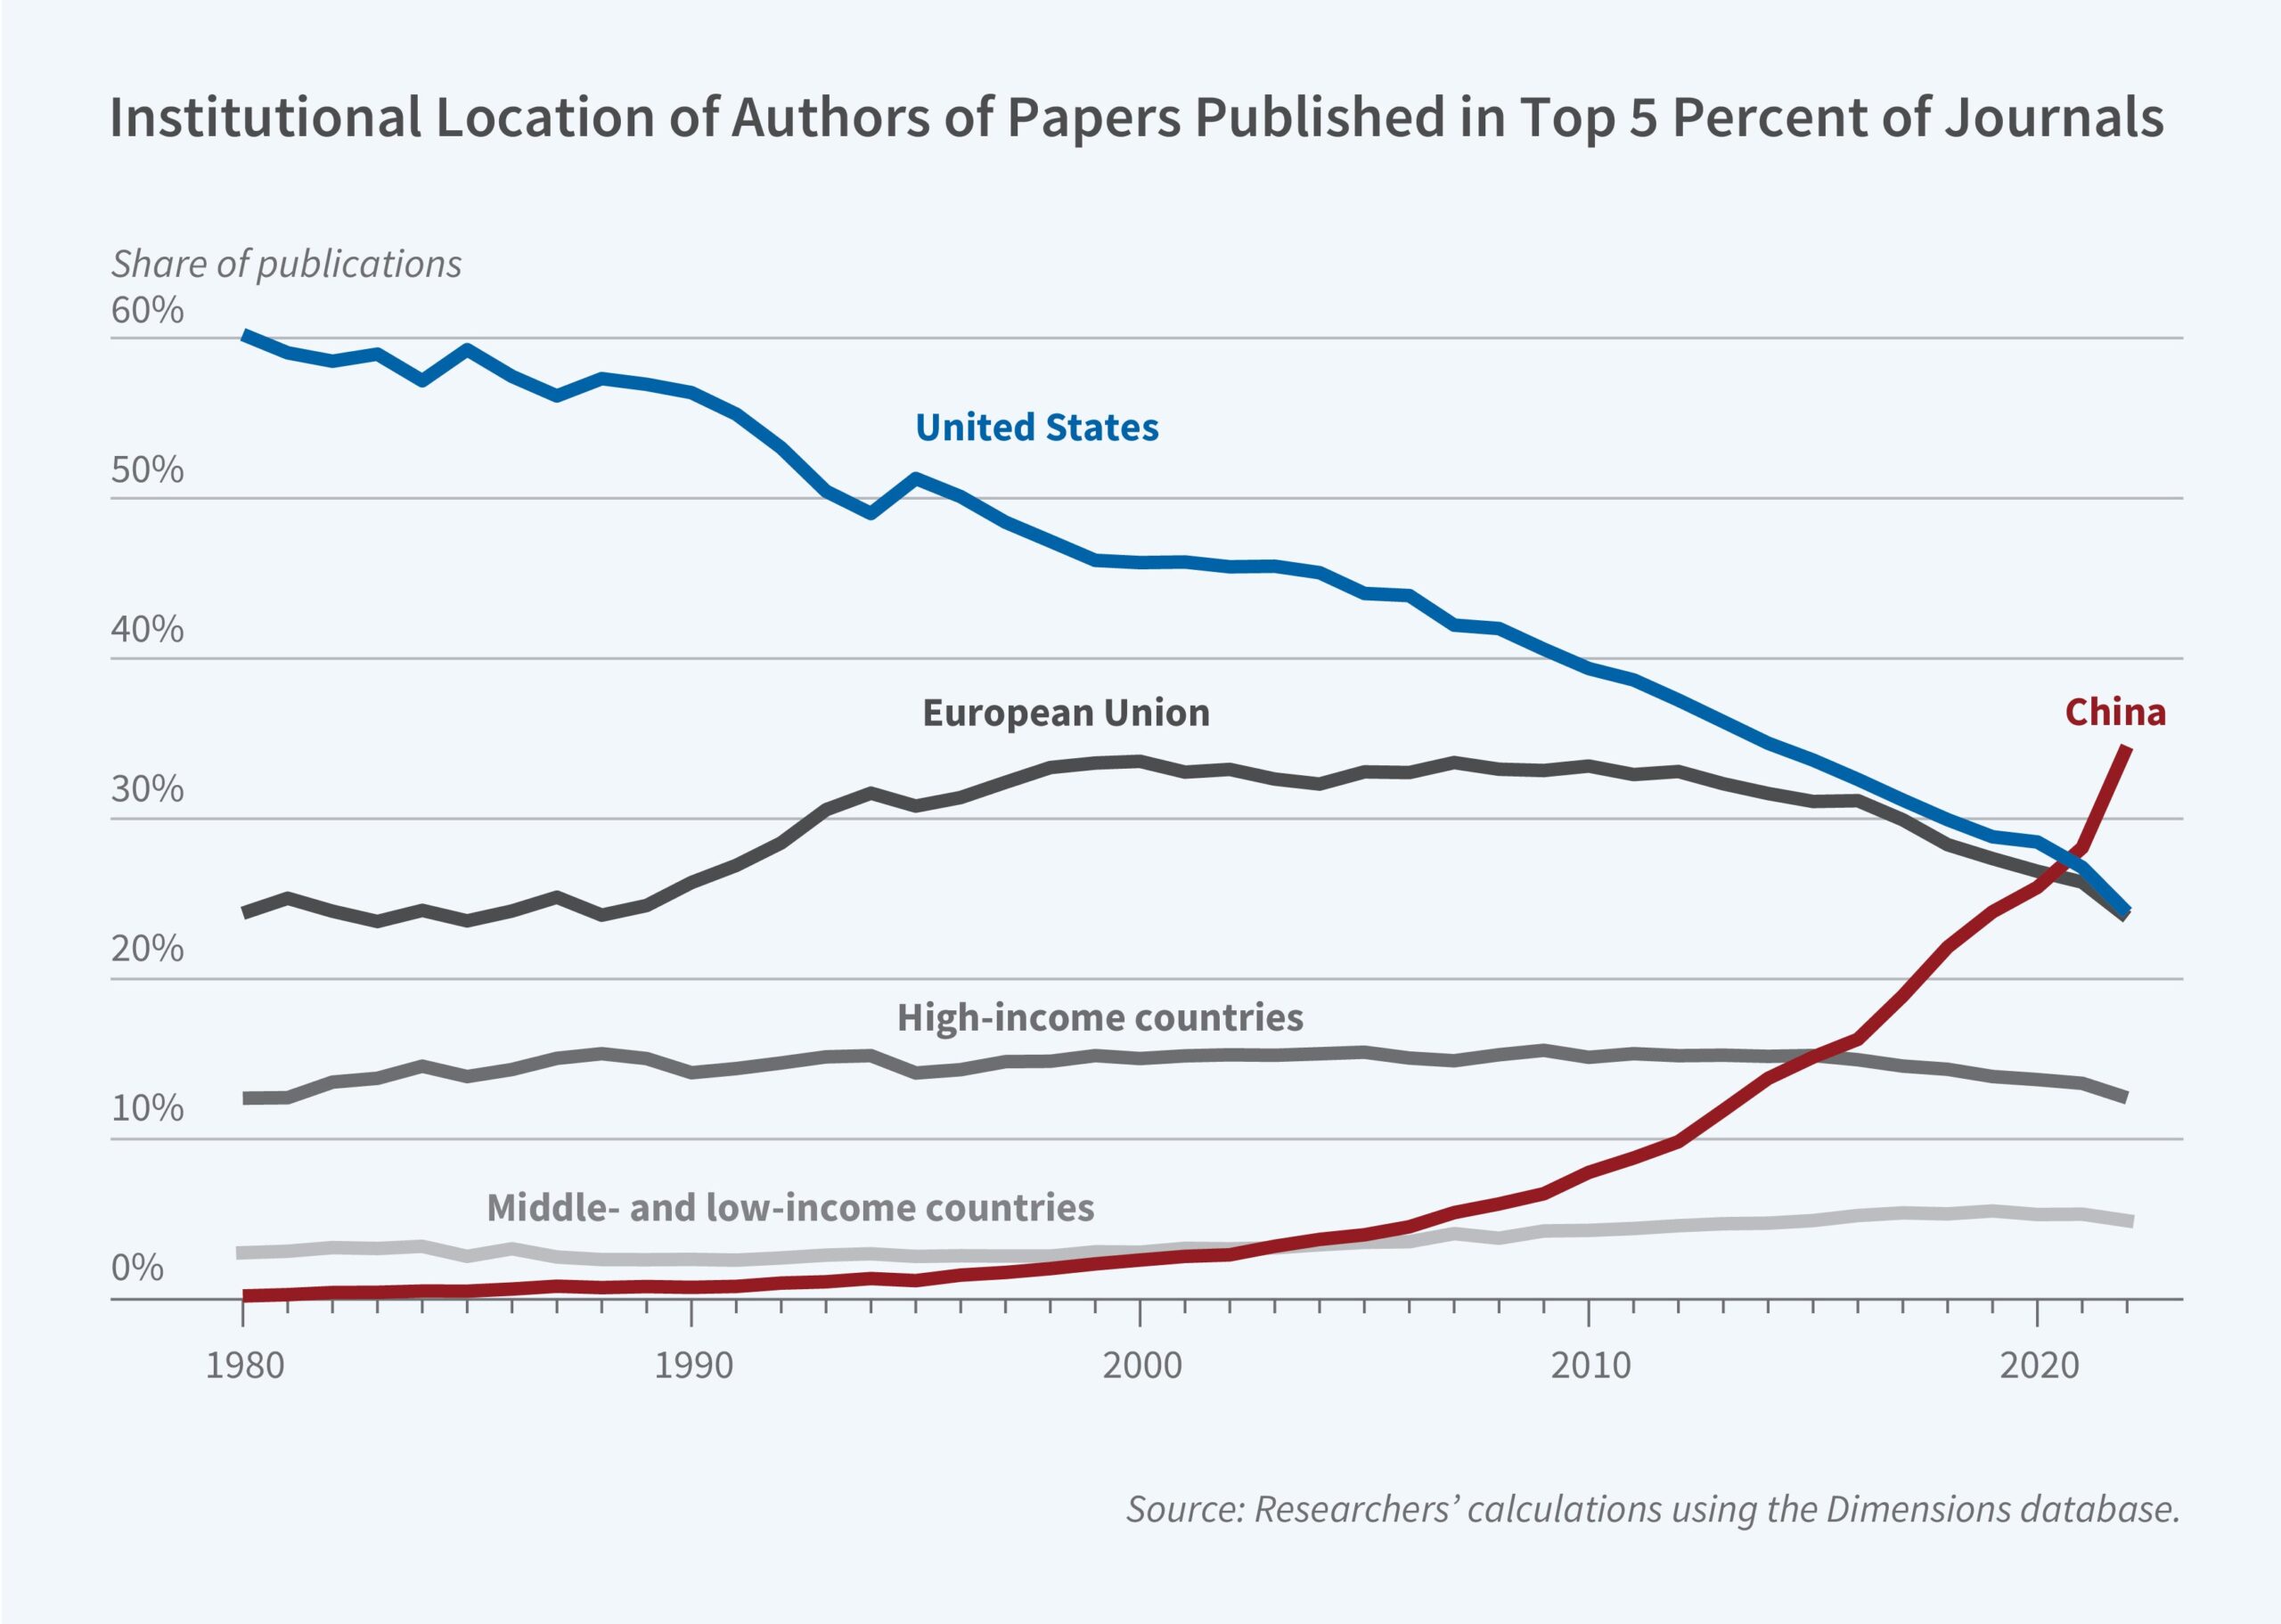
Although the West has dominated scientific research around the world since the nineteenth century, recent decades have seen profound changes in where research is conducted, what topics it covers, and the extent to which its findings are spread across borders. In The Geography of Science (NBER Working Paper 34694), Abhishek Nagaraj and Randol Yao provide … Read more